
Thomas Goossens


Construction of an operational web-platform designed for real-time agro-meteorological data dissemination at high spatial (1km²) and temporal (hourly) resolution.
The European directive 2009/128/CE imposes member-states to set up tools that allow for a more rational use of crop protection products. Among these tools, agricultural warning systems, based on crop monitoring models for the control of pests and diseases are widely adopted and have proved their efficiency. However, due to the difficulty to get meteorological data at high spatial resolution (at the parcel scale), they still are underused. The use of supervised machine learning algorithms (Kriging, Multiple Regressions, Artificial Neural Networks, etc.) makes it possible to interpolate data provided by physical weather stations in such a way that a high spatial resolution network (mesh size of 1 km2) of virtual weather stations could be generated. This is the main objective of the AGROMET project.
The project aims to set up an operational web-platform designed for real-time agro-meteorological data dissemination at high spatial (1km2) and temporal (hourly) resolution. To achieve the availability of data at such a high spatial resolution, we plan to “spatialize” the real-time data sent by more than 30 connected physical weather stations belonging to the PAMESEB and RMI networks. This spatialization will then result in a gridded dataset corresponding to a network of 16 000 virtual stations uniformly spread on the whole territory of Wallonia. These “spatialized” data will be made available through a web-platform providing interactive visualization widgets (maps, charts, tables and various indicators) and an API allowing their use on the fly, notably by agricultural warning systems providers. An extensive and precise documentation about data origin, geo-statistic algorithms used and uncertainty will also be available.
The following figure shows a first draft of the functional architecture of the platform :
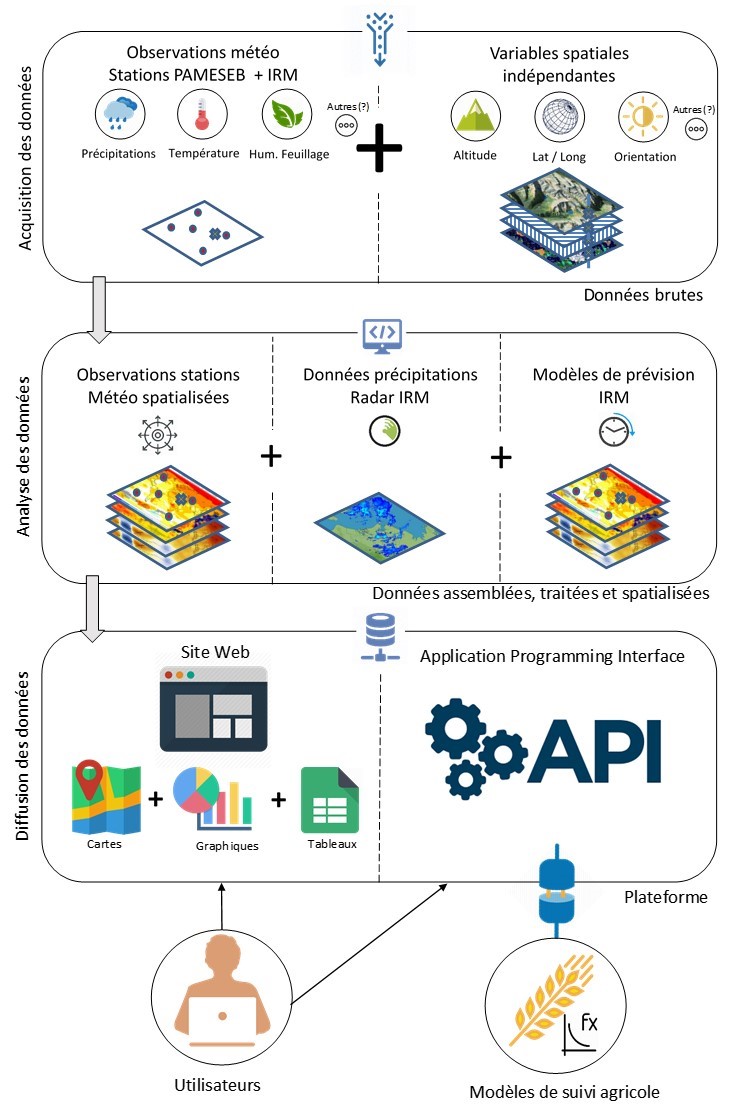
agromet schema
The agro-meteorological parameters to be spatialized are the following :
Given that the quality of the output data from models used in agricultural warnings is largely dependent on the quality of the input weather data, particular attention will be given to the :
The choice of the appropriate interpolation methods that will be used to populate the 16 000 virtual weather stations network will rely on investigations already performed in other institutions. Inspired by these experiences and the available scientific literature, tests will be conducted for each of the meteorological variables, in order to determine which will be the most adapted “spatialization” method (e.g. Multiple Regressions, Kriging, Aurelhy, IDW, etc.) while considering the constraints of our wanted operational system :
The independent variables to be tested for the “spatialization” procedure will notably be :
To insure that the platform will take in account the needs of end-users, a preliminary survey stage will be conducted. This functional analysis would address the following points :
Once we have one or more validated methods for each of the meteorological variables to be “spatialized”, will be implemented two custom “pilot” crop monitoring models (orange wheat blossom midge and wheat leaf rust) operated with the “spatialized” weather data from the 16 000 virtual stations. The output results will then be validated by field trials. These tests will allow us to perform the necessary fine-tuning on the algorithms and platform general design prior to its public release.