
Thomas Goossens


As a data scientist, you certainly produce a bunch of tables, plots, maps and many other kind of outputs to let your data “speak for itself”. This is your core business and I’m sure you do it pretty well ! But when it comes to make this data available to your target audience things can quickly get more frustrating. How to share these outputs in a format that everyone can open ? How to easily send these to 100 persons ? How to notify them of any updated output ? How to make these outputs more interactive so that your audience can get a full insight of your data analysis ?
R and web technologies can help you to solve these problems you probably have already encountered.
Thanks to the advances in web technologies and the development of powerful Javascript librairies, our web-browsers are now able to render impressive data visualization apps and presentations. These last years, the R community has developed countless libraries (leaflet, shiny, plotly, knitr, etc) that take advantages from these advances.
You can now easily and quickly transform your analysis outputs in eye catching web apps that make your data intelligible !
In this post we will see how to combine these R libraries capabilities with Github pages in order to quickly make your top notch data visualization output available to your audience (and don’t be modest : to the world)
Before we dig into the topic, it is important to first understand what a webpage actually is. So here is a short recap !
When you enter an address (URL) in your web-browser, it sends a request to the hosting server. In returns, the server sends to your web-browser the requested content in the form of an HTML file. HTML is simply a kind of formatted text that contains specific tags to structure your text (headings, tables, lists, text formatting, etc) and that can eventually link to other documents. The role of your web-browser is to translate this non-human readable HTML to its human friendly version (if it is not clear, check this example).
This HTML can be “upgraded” by 2 other languages also supported by your web-broser : CSS and Javascript. While CSS is responsible for the styling (font color, background color, font-size, etc), the Javascript manages the interactivity (like zooming on a map), the animations and the actions that can be performed by/on the web-page (like actions triggered by clicking on a button). And that’s it ! You can build any webpage with these 3 ingredients.
As Github pages only works with static content, an important thing to get in mind is the difference between a static and a dynamic webpage !
For those who are familiar with the version control software git you most probably already knows Github as a git repository hosting service (if you don’t know what git is, you really must get to know it to impressively speed up your (R) code development). Github offers many other possibilities : collaborative code developement, issues tracking and discussions, project presentation page, wiki, Jekyll blog and various integrations with other web services thanks to their API. Among these features, exists Github pages which is intended to allow you to publish static pages without the need to run our rent your own webserver. So, as long as your datavisualization output does not require any running backend (be it in node.js, Python, R, Java, Ruby, etc), you can host it on Github pages ! Unfortunately this means that R Shiny apps can not be hosted on Github pages. But yeah, you can still publish leaflet maps, plotly graphs and knitr html reports ! That already opens up a wide range of possibilities !
What does Github pages actually does ?
Github pages turns your repository containing your source file hosted at :
https://github.com/yourUserName/repositoryName
to a rendered web-page hosted at :
https://yourUserName.github.com/repositoryName
The workflow is as follows (more details with an example here below) :
gh-pages branchhttps://yourGithubUsername.github.io/repositorynameTo illustrate this process, we will use R to build an interactive leaflet map that displays two layers : A DEM of Belgium and a WMS layer of currently observed precipitations provided by the KNMI.
Once you have created a Github account, go to https://github.com/yourUserName, click on the + button and select new repository. Give it the name myoutputs (or whatever you want) :
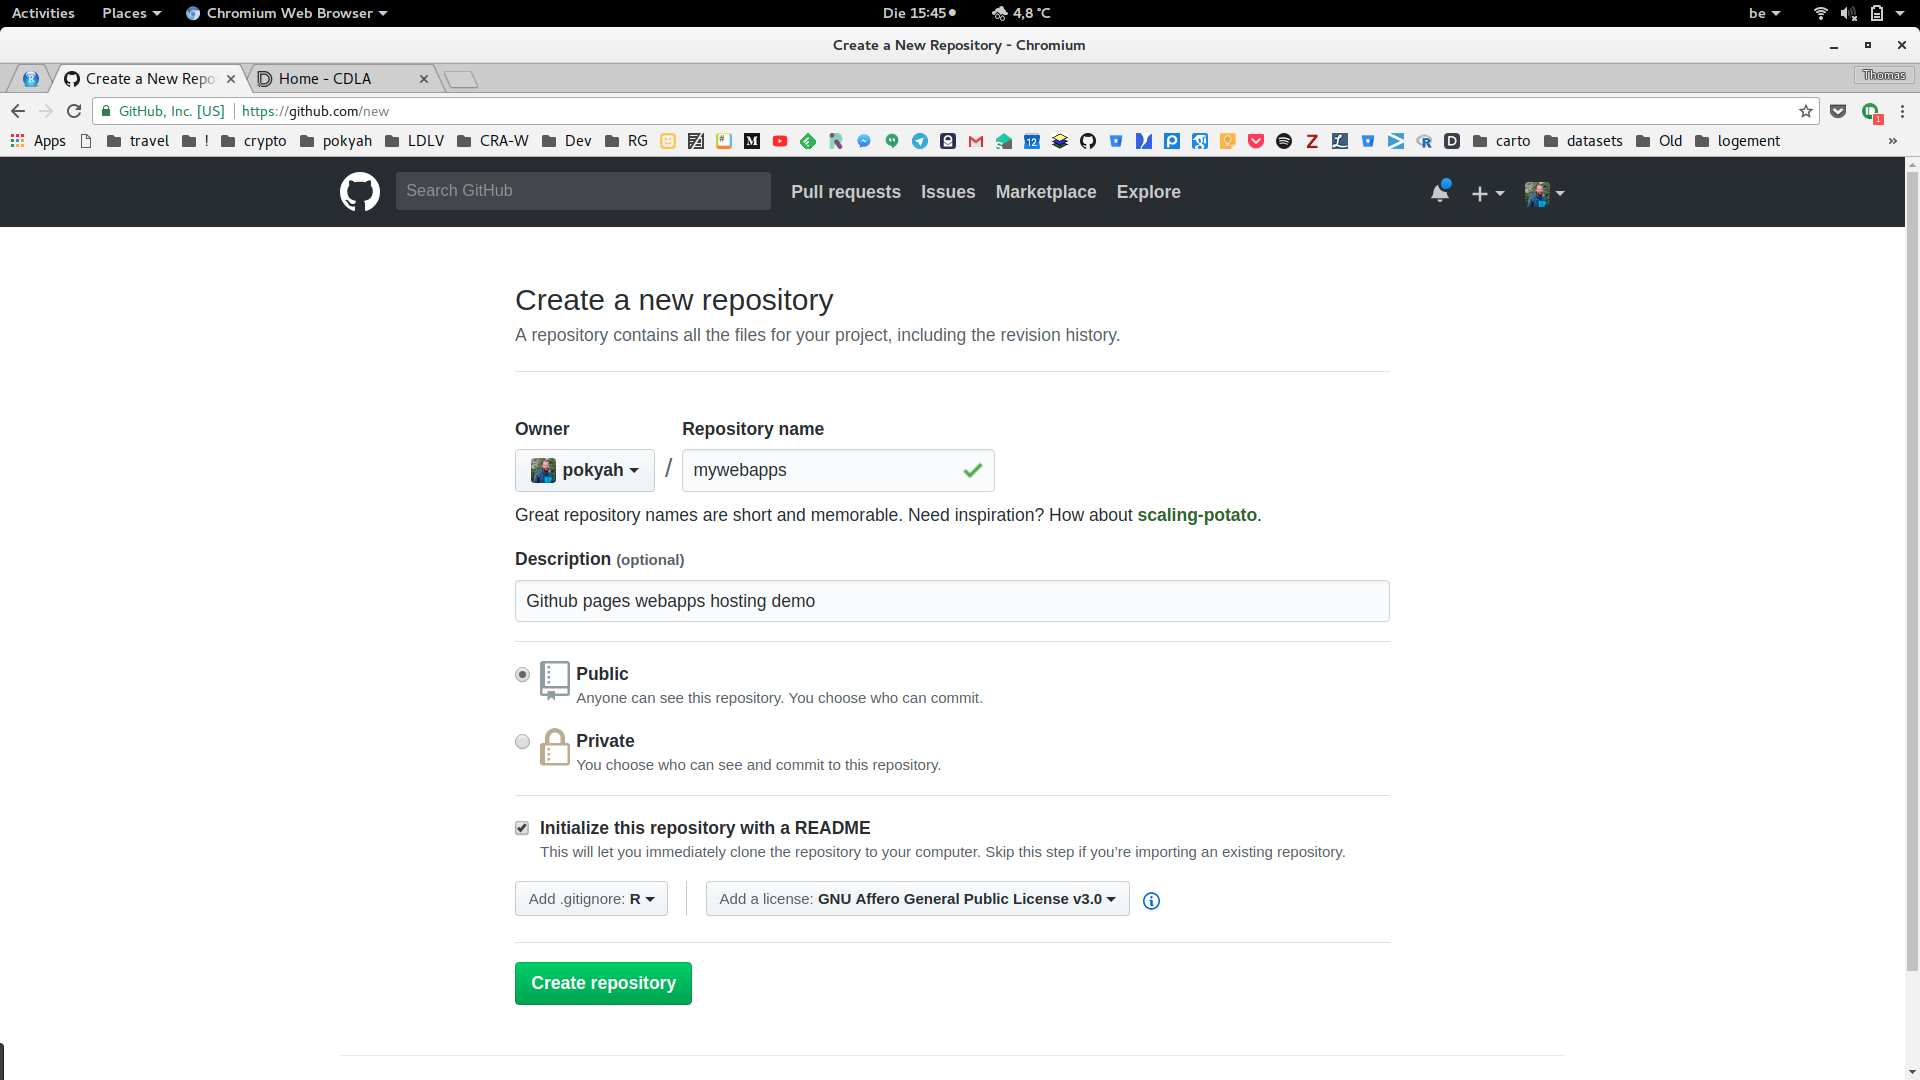
github new repository screenshot
Eventually add a description and choose an existing .gitignore file and license and click on create repository. You are now on your Github myoutputs repository page. Click on the green button Clone or download, then on the link use HTTPS (you can of course also use SSH if you know what it means) and copy the link provided in the text box :
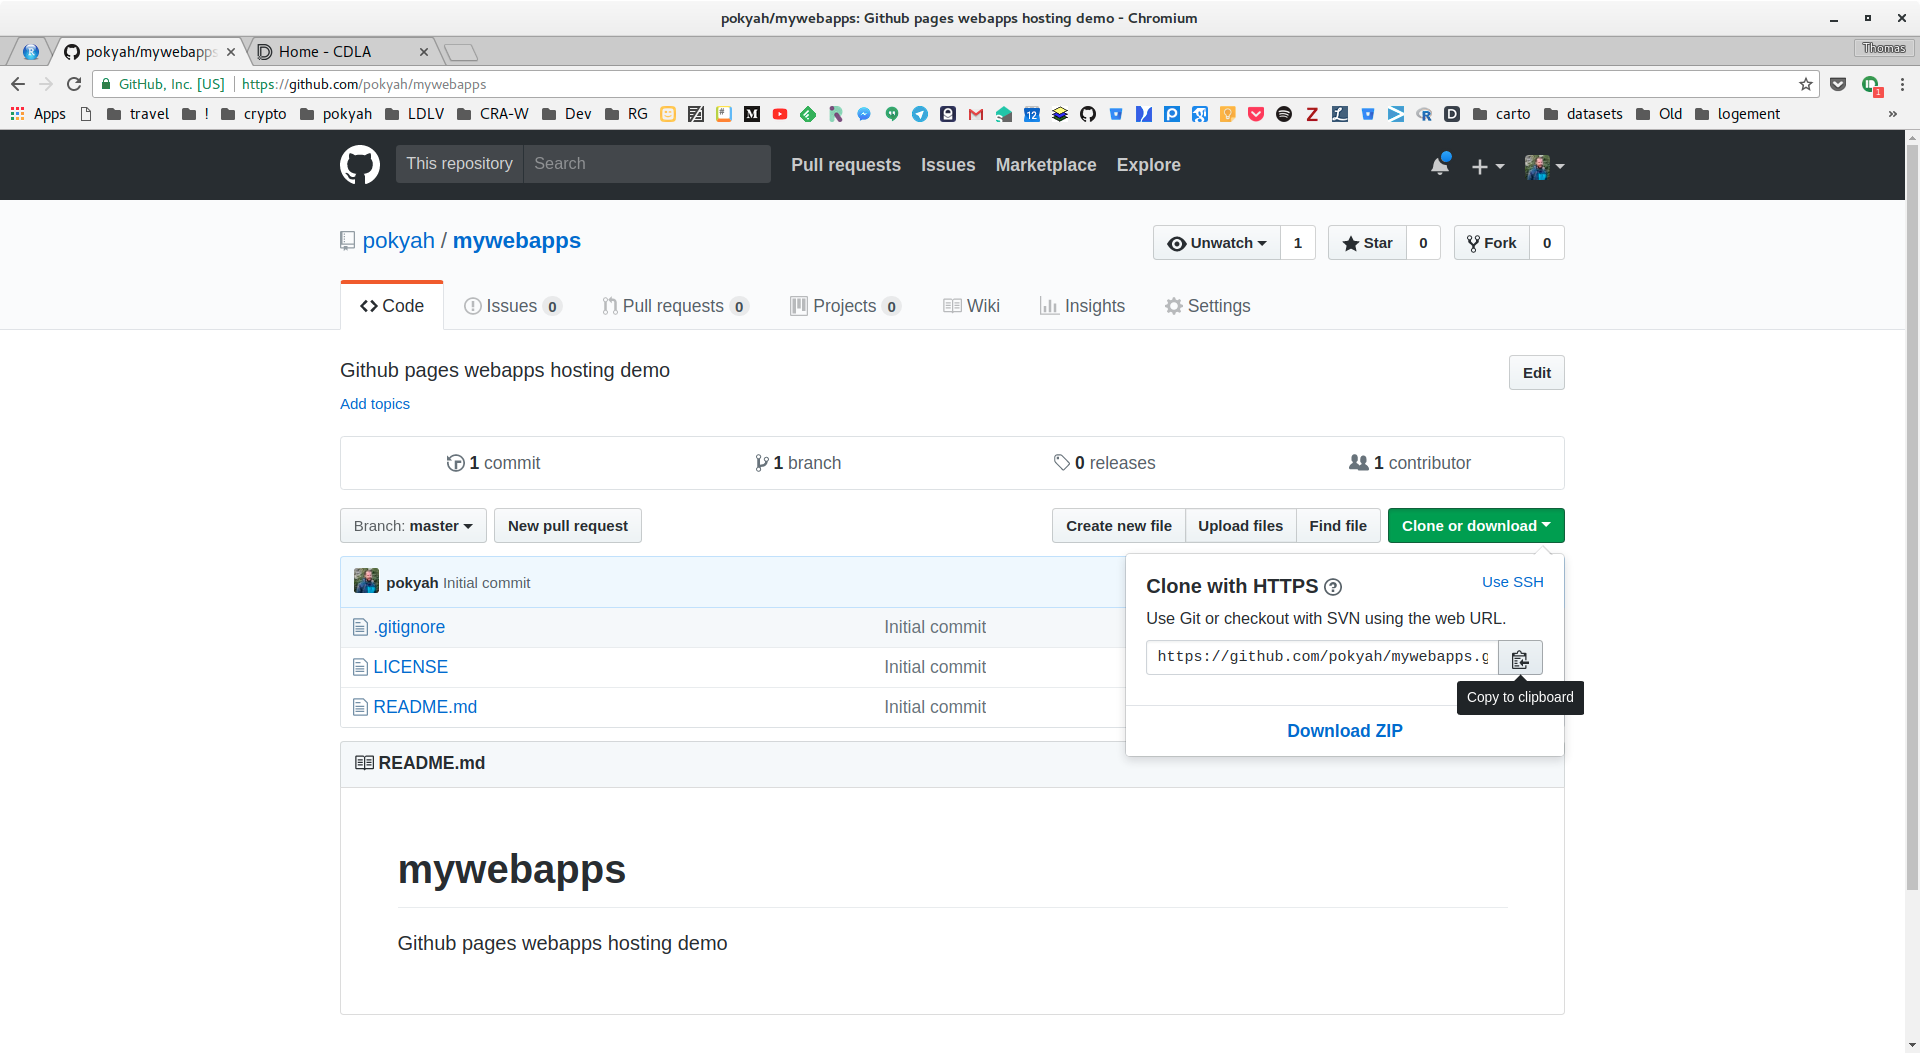
github clone screenshot
Let’s create a folder called dev under your home directory into which we will clone the online repository by pasting its addresse as a parameter of the git clone command in your terminal (more about the use of git with the command line) :
$ mdkir ~/dev
$ cd ~/dev
$ git clone https://github.com/yourUserName/myoutputs.git
Enter your Github username and password (if you have choosen HTTPS instead of SSH), press enter and your dev folder now contains a myoutputs folder which is a git repository (i.e. the root of the myoutputs folder contains a hidden .git folder that manages all its git features). Let’s check this :
$ ls -alIf everything went OK, you should see the myoutputs and the .git folder listed in your terminal. Now, let’s create a specific branch (more about branches here) for automatic hosting and publishing of your outputs! Github uses gh-pages as the default branch name to create an hosted webpage version of your repository source code. So let’s create it and use it !
$ git checkout -b gh-pagesYour are now ready to build some git versioned code and make it ready to be published on the web through the magic of git and Github pages !
Download the source of the demo-map.R (which is intended to produce an HTML leaflet map) script and save it under your myoutputs. Open your terminal inside this folder and execute it :
$ Rscript demo-map.RThe script has produced a demo-map.html file containing the interactive map plus a demo-map_files folder containing all the required javascript libraries required to make it interactive. It has also saved 3 files resulting from the download of the raster elevation data. The resulting map looks like this :
If you get errors it might be because you don’t have the required libraries installed. To avoid such problems, simply install the missing libraries (and if you are adventurous enough, you can have a look at my R + Docker tutorial!)
Your interactive web map is now built ! You can locally open it by right-clicking on the demo-map.html file and choose to open it with your favorite web-browser. Check the various buttons to be sure that everything works as expected. What is important to know is that this impressive web app does not need any backend to run. Once the page is loaded, everything works inside your web-browser thanks to HTML, CSS and Javascript !
Ok, but how is it then possible for me navigate and zoom in every part of the world without having to run a server to get the base layer tiles ?
That’s probably what you will tell ! The trick is that leaflet render tiles stored on a third party tiles provider (i.e. a web-server). It is actually a simple line of Javascript that does the magic of calling the tiles and serving these to your web-browser. If you turn your wifi off, you will see that you won’t be able anymore to see the base layer while navigating the world.
Head back to your terminal (opened in your myoutputs folder) and save and publish your work to Github.
$ git add .
$ git commit -m "adding interactive demo-map.html"
$ git push --set-upstream origin gh-pages
Now the source code of your interactive map (both the demo-map.R and the demo-map.html ) has been pushed to https://github.com/yourUserName/myoutputs and your hosted interactive map is rendered at https://yourUserName.github.io/myoutputs/demo-map.html !
Great ! Simply share this link to your audience and you are done ! Your interactive webmap is available to them !
Sometimes github pages struggles to rebuild your rendered page when you commit your changes. If this happens, you can force github pages to rebuild it using these two git instructions (solution found on stackoverflow) :
$ git commit -m 'rebuild pages' --allow-empty
$ git push origin gh-pagesIf you want to showcase multiple interactive data visualizations outputs, it might be cool to have a webpage that presents all of them so that your visitors can easily discover your work. The simplest solution is to create an index.html file that lists all your outputs and that is located at the root of your myoutputs directory. Doing so, while your visitors head at https://yourUserName.github.io/myoutputs, the index.html will act as a home page and your visitors will receive a listing of the outputs you have add to your myoutputs repository.
You have two options to maintain this directory listing index.html file updated. Either you manually add a new line for each new interactive output you want to showcase, either you run a bash script that build the index.html file for you (preferred).
Download and save this bash script under your myoutputs folder. Make it executable :
$ chmod a+x index-html.shThis script is intendend to automatically generate an index.html files that lists all the files available in a specific folder. Let’s run it :
$ ls | ./index-html.sh > index.htmlYou now have a nice index.html files that lists all your files stored in your myoutputs folder.
Each time, you run this bash script to update you index.html file, you of course have to push it to Github so that when your visitors head at https://yourUserName.github.io/myoutputs they get an updated list of all your files available. For this purpose we do as previsously mentioned : add, commit and push :
$ git add .
$ git commit -m "adding index.html and updating it with bash script"
$ git push origin gh-pagesYou are now able to publicly share your best R interactive datavisulization HTML outputs thanks to Github pages. You are of course not limited to R. You can use this system to showcase any HTML/CSS/JS creation, be it a full static website (great templates available here) our a little javascript game for example.
If you want to easily host a blog with Github pages, have a look at Jekyll and this excellent easy and instant Jekyll install repository (that I have used to build this blog).